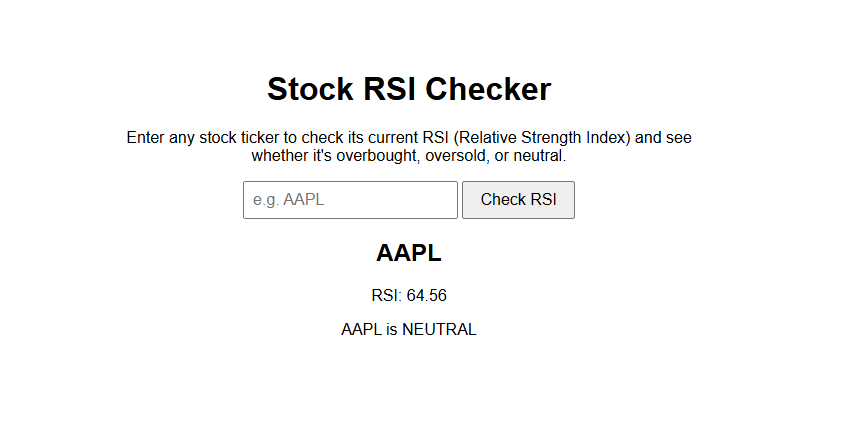
I built an RSI Alert Bot that currently takes any stock ticker, works out its Relative Strength Index (RSI), and tells you whether the stock is overbought, oversold, or neutral. All you have to do is type in a symbol, and it pulls the last three months of price data, runs a calculation, and gives you an answer. Currently, it's running as a small website on my machine but the goal is to turn it into a bot that watches stocks for myself and others, so it can ping my phone when a stock is either overbought or oversold.
Why I built it
The reason I chose this as my first coding project in a while was because I recently found myself reading more and more about finance and the term "RSI" kept showing up. People online kept throwing around the term, and I thought it was a great opportunity to build something I'd actually use on a day to day basis, with the added benefit of helping me actually understand the term and its importance. Through that loose idea of this project, it turned into a slightly bigger plan as I imagined using a telegram bot, different importable libraries, and publishing it on a live web server.
What RSI actually is
RSI stands for Relative Strength Index. It's a measure of momentum for stocks. The idea is to look at how a stock has moved recently and compare the size of its up days against the size of its down days over a set time, usually 14 days. If the gains have been much bigger than the losses lately, RSI climbs toward 100. If the losses have been dominating, it drops toward 0.
Traders read it on a scale. Above 70 usually means the stock is overbought, so it has run up fast and might be due for a drop. Below 30 means oversold, the opposite case, where it has fallen hard and might bounce back. Anything in between is just neutral, no strong signal either way. Those thresholds aren't exactly laws, but they are the standard convention.
When I was coding, the part that took me the longest was the calculation method. The simple version averages the gains and losses evenly across all 14 days, which is what I originally started with. The version most real platforms use is called Wilder's smoothing, which is an exponentially weighted average. In simple terms, it weights recent days more heavily than older ones, so the RSI reacts a bit faster to what the stock is doing right now. I went with Wilder's version because getting the same answer as an actual trading platform mattered more to me than keeping the code slightly simpler, and it helped me understand how stock traders truly use these types of indexes.
How the code works
The core of the whole thing is one function. It takes a ticker, pulls three months of daily closing prices, and turns that into a single RSI number. The way I get the values is from the Yahoo Finance Library.
import yfinance as yf

# pulls price data and returns the latest RSI value
def calculate_rsi(ticker, period=14):
    stock = yf.Ticker(ticker)
    data = stock.history(period="3mo")

    if data.empty:
        raise ValueError("No data found for that ticker.")

    delta = data["Close"].diff()
    gain = delta.where(delta > 0, 0)
    loss = -delta.where(delta < 0, 0)

    avg_gain = gain.ewm(alpha=1/period, min_periods=period).mean()
    avg_loss = loss.ewm(alpha=1/period, min_periods=period).mean()

    rs = avg_gain / avg_loss
    rsi = 100 - (100 / (1 + rs))
    return round(rsi.iloc[-1], 2)
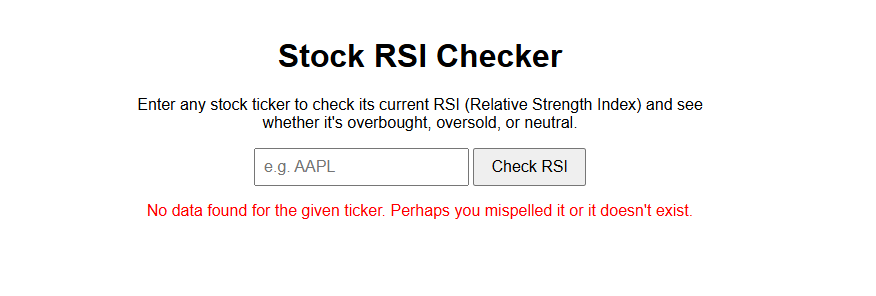
Reading from top to bottom, I first had to import the Yahoo Finance Library. This had all of the data and stocks I needed. Then, delta is the day-to-day price change. I split that into gains and losses, then take Wilder's smoothed average of each with .ewm(). The ratio of those two averages is the relative strength, and the last line squeezes that ratio onto the 0 to 100 scale and grabs the most recent value. Additionally, the check at the top for wrong or empty values matters more than it looks. If someone types a ticker that doesn't exist, the data comes back empty and the math would blow up with a confusing error. Instead I raise a clean message that the rest of the app can catch and show nicely!
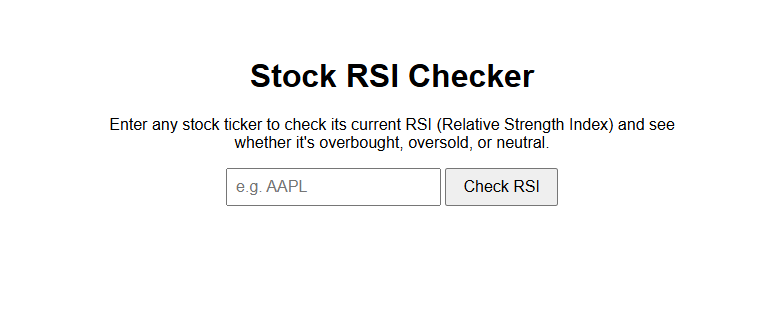
The website around it is a small Flask app. There's one page with a text box and a button. When you submit a ticker, Flask calls the function above, wraps it in a try/except so a bad ticker shows a friendly red message instead of crashing, and then renders the result on the page.
What I learned
I learned a lot from a project of this size, and more than I expected, honestly. At first, I thought I would only learn about libraries and RSI. However, writing the RSI logic forced me to actually understand what I was calculating, instead of just repeat a definition like I was learning before. On the coding side, I rehashed my python skills and learned a lot on how Flask communicates with python, and how to use functions effectively. Additionally, this was my first time ever doing a full Git workflow, with staging, committing, and pushing my first repo to GitHub!
I think the most important lesson was my learnings on private information. At first, when I was learning about how to connect a telegram bot, I didn't realize how sensitive the information about tokens was, and I almost published my token right onto GitHub. I figured out how to use .gitignore to fix this problem, and put all my important data into a .env file. I'm glad I learned this lesson now, because if I did this later in my career or in a workplace, anyone online could be able to access my telegram bot.
If you want to build your own
Start with just the RSI function, nothing else. Get it printing a number in the terminal and check that number against a real trading platform for the same stock. Once the math is right, everything after that is easier. Then wrap a basic Flask page around it, and only then worry about making it look good. If you don't know how, use the tools online! Even AI LLMs can help a lot if it's your first time, and I used some to help me learn how to use flask effectively. The repo above is a fine starting point and to take in your own direction. Swap the data source, change the thresholds, or add whatever alert method you actually would use! Overall, this is a fantastic first project if you are interested in coding and finance, and if you ever build something similar to this, reach out to me so we can connect about it.
Where it's headed
This is still in progress, and the name is a bit of a promise I haven't fully kept yet. Here's the plan:
- Telegram alerts, which was the main goal in the first place. Instead of you checking a stock, the bot watches a list for you and messages you the moment something crosses into overbought or oversold. That turns it from a checker into an actual alert bot.
- A live version. Right now it only runs on my computer. I want to host it so anyone can use it from a link, and connect it so it can send those updates to you directly.
- A more interactive site. Track several tickers at once, save the ones you care about, and make the whole thing nicer to actually use.
If you want to see where it's at, the code is public and I'm updating it as I go.